
Chart pages
The chart page displays one of the multiple measurements taken by the IMPC on a specific IMPC knockout line and the corresponding controls.
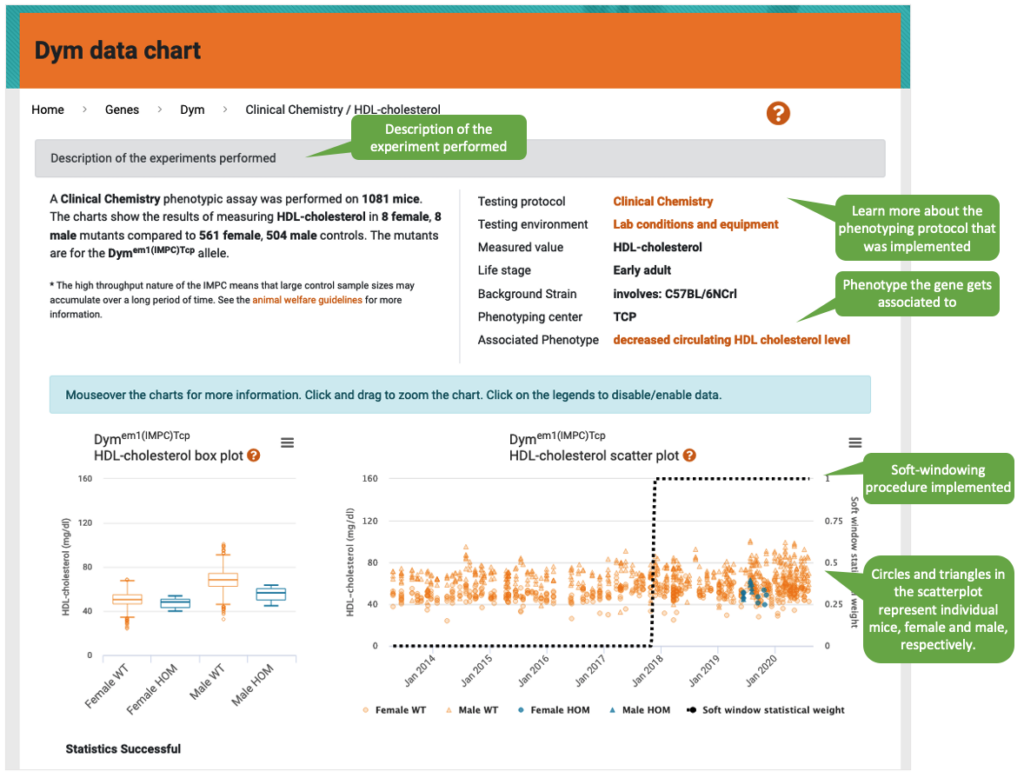
Chart pages can be accessed from the Gene and Phenotype pages by clicking on a phenotype or measurement. You may try yourself here https://beta.mousephenotype.org/data/genes/MGI:1918480 (gene page) or here https://beta.mousephenotype.org/data/phenotypes/MP:0003947 (phenotype page).
Description of the experiment
The description box indicates the number of control and mutant mice measured, as well as the mutant line (allele). Links on the right provide further details. If the association is significant, this will be indicated (Associated phenotype).
Boxplots
Each box depicts the median (the middle value of the dataset; Q2 or 50th percentile), the first (lower) quartile (Q1 or 25th percentile), and the third (upper) quartile (Q3 or 50th percentile). Whiskers extend 1.5 the Interquartile Range (IQR; the distance between the upper and lower quartile), below and above the box, up to the lowest or largest observed data point from the dataset that falls within this distance, respectively. The remaining data points are plotted as individual points.
Scatterplot
Each point represents two variables in the data set, the value for the measured parameter (vertical axis) in a given mouse, and the date in which the parameter was measured (horizontal axis).
Soft windowing
Starting from DR 15.1, users of the IMPC website will find a soft windowing approach implemented to the statistical analysis of IMPC data. Soft windowing is a novel approach that allows to give more weight to controls collected close in time to the mutant mice. While the individuals belonging to a specific mutant line are normally phenotyped in a narrow window of time, controls are collected over long periods of time, typically years in the case of the IMPC. The soft-windowing approach reduces the unwanted but time-dependent noise level in the data, thus avoiding fluctuations in the data that are due to unknown effects, such as experimenter’s effect.
You can read more about this novel approach in our blog post or in an article publihed in the Journal of Bioinformatics (2019), where the method is described in detail.
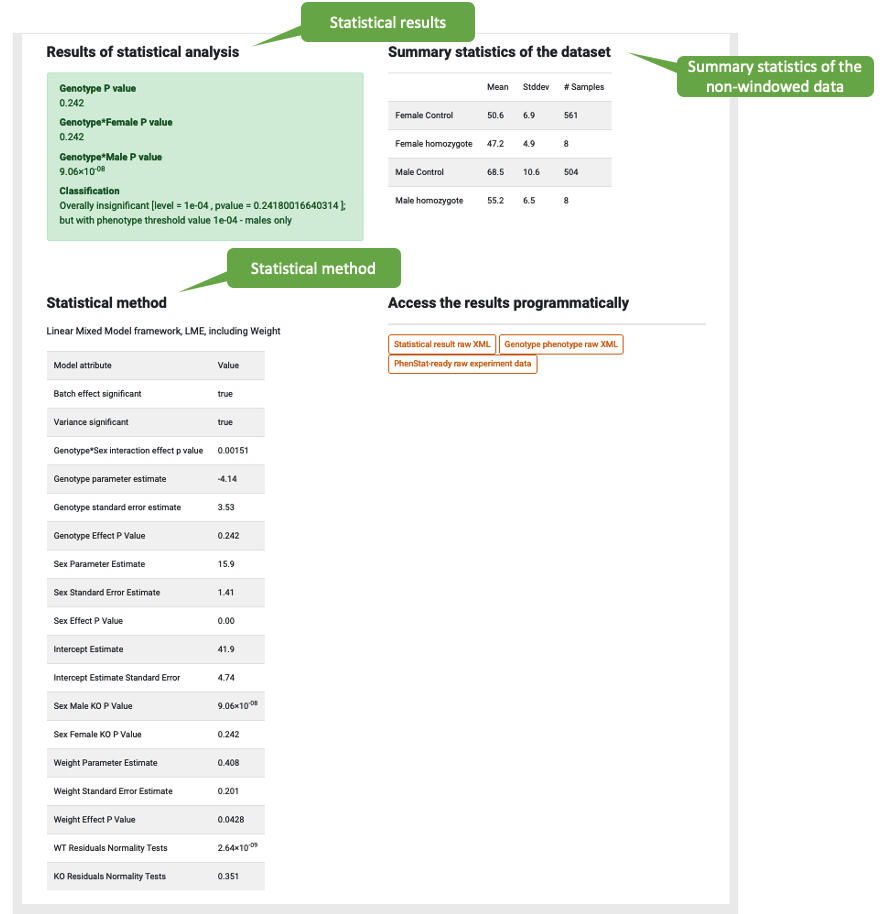
Statistical analysis
Results for the statistical analyses are depicted in the green box. When the P-value < 1 x 10^-4, a signficant genotype-phenotype association is made. Summary statistics and details of the statistical method are provided. Please refer to the statistical analysis help pages for more information about this.
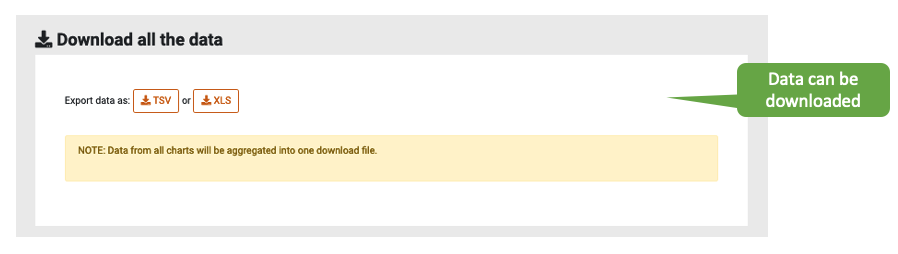
Downloads
Graphs, XML files and all data in TSV and XLS format are available for download.