Jump to:
Purpose
The glucose tolerance test measures the clearance of an intraperitoneally injected glucose load from the body. It is used to detect disturbances in glucose metabolism that can be linked to human conditions such as diabetes or metabolic syndrome. Animals are fasted for approximately 16 hours, fasted blood glucose levels are determined before a solution of glucose is administered by intra-peritoneal (IP) injection. Subsequently, the blood glucose level is measured at different time points during the following 2 hours.
Ontological description: MP:0005559 - increased circulating glucose level, MP:0005560 - decreased circulating glucose level, MP:0005293 - impaired glucose tolerance, MP:0005292 - improved glucose tolerance, MP:0005291 abnormal glucose tolerance, MP:0000188 - abnormal circulating glucose level.
Experimental Design
Equipment
- Mouse restraining device (optional)
- Glucose meter
- Scalpel blade
- Balance
- Timer
- Clean cages
Procedure
- Fast mice overnight for approximately 16 hours by transferring mice to clean cages with no food or faeces in hopper or bottom of cage. Ensure that they have access to drinking water at all times.
- Prepare an experiment record sheet, syringe and sticks for glucose measurement and glucose solution.
- Weight the mouse.
- Calculate and record the volume of 20% glucose solution required (2g of glucose/kg body mass) for IP injection as follows: volume of IP glucose injection (μl) = 10 x body weight (g).
- Optional application of topical anesthetic cream:
- Apply a small amount of topical anesthetic cream to the tail of the mouse, spreading over the tail evenly
- Gently massage it in for ~10 seconds to enhance the effect of the anesthetic cream ensuring that the proposed incision site is fully covered
- Allow an appropriate length of time for the loca anaesthetic to take effect.
- Optional: Restrain the mouse in the restraining device with the tail exposed.
- Score the tip of the tail using a fresh or sterilized scalpel blade
- Discard first small drop of blood. A small drop of blood (<5μl) is placed on the test strip of the blood glucose meter. This is the baseline glucose level (t = 0) and is recorded in the experiment record sheet.
- Remove the mouse from the restraining device.
- Inject the mouse intraperitoneally with the appropriate amount of glucose solution, as previously determined (point 3) and note the time-point of injection.
- The blood glucose levels are measured at 15, 30, 60 and 120 minutes (t = 15, t = 30, t = 60 and t = 120) after glucose injection, by placing a small drop of blood on a new test strip and recording the measurements. Start the bleeding again by removing the clot from the first incision, massage the tail if blood flow is inadequate. Results are recorded in the record sheet.
- Ensure that further blood loss from the incision is minimal by briefly applying pressure to the incision after each measurement. At the end of the experiment add food to the cage and make sure that a plentiful supply of water is available to the animals.
- At the end of the experimental session, place the mouse in a clean cage with water and food available ad libitum.
- Monitor the animals carefully to observe any abnormal behavior(s).
Notes
The information about the date of the experiment, that is the date when the measurement is performed, is an important parameter which is to be submitted in the Experiment xml file (dateOfExperiment="2013-02-28").
If the meter shows a 'high value', a parameter status code IMPC_PARAMSC_008 ('Above upper limit of quantitation') should be submitted with the upper limit of the meter under metadata parameter IMPC_IPG_013_001 ('Upper limit of the meter').
Area Under Curve
Area under curve is calculated relative to the fasted blood glucose concentration (concentration at T0), rather than an absolute value relative to the X-axis (0mg/dl). By this method, the response of the animal is measured while taking into account its starting value.
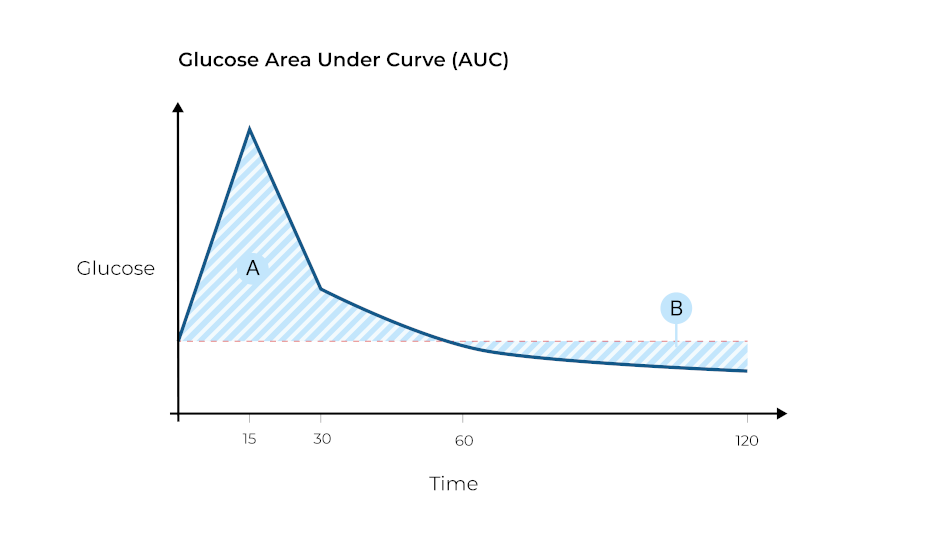
NB In this example Area B is a negative value, as glucose concentrations have dropped to lower than the initial fasted value. If the animal shows a brief/weak spike followed by an extended period where glucose concentration drops far below the fasted value, area A might be smaller than area B i.e. the resultant total area under curve might be negative.
Data QC
Perform a QC check of the glucose meter routinely as outlined in the manual.
Metadata and examples
|
Metadata |
Example |
|
Equipment ID |
ID of the machine used when more than 1 is used having same model and manufacturer. E.g. machine 1, machine 2, machine Minnie, machine Mickey Mouse, etc. |
|
Equipment manufacturer |
Manufacturer of the equipment. E.g. Roche Diagnostics Ltd. |
|
Equipment model |
Model of the equipment. E.g. Accu-Chek Aviva. |
|
Mouse restrained |
If the mouse is restrained in order to score its tail for blood analysis. E.g. Yes/No. |
|
Type of strip |
The strip used to analyse the blood can be for whole blood or for plasma. E.g. Plasma/Whole blood/Plasma, no maltose interference. |
|
Experimenter ID |
An ID of any format to be used coherently both inside the same procedure and for all procedures. E.g. Harw_001, or 1/2/3. |
|
Date equipment last calibrated |
Most recent date in which the equipment (or any part of) used in the procedure was subject to a calibration event. |