Jump to:
Purpose
Auditory brainstem response test determines hearing sensitivity and other physiological parameters using evoked potential recordings in anesthetized mice.
Ontological description: MP:0004738 - abnormal brainstem auditory evoked potential.
Experimental Design
Equipment
1.Audio signal generators, amplifiers and loudspeakers
2.Calibration equipment (microphone, etc)
3.EEG Needle electrodes
4.Biological amplifier & headstage
5.Data acquisition hardware
6.Software to control signal presentation and data acquisition
7.Data Analysis software/database application
8.Sound Attenuating chamber
9.Heating blanket
Procedure
- Test mouse with click box. Is the Preyer Reflex present? Optional.
- Anesthetize the mouse.
- Place mouse on heating blanket in sound chamber and insert sub dermal needle electrodes; active electrode on vertex; reference electrode overlying left bulla; ground electrode overlying right bulla (See Figure 1).
- Place mouse unrestrained in a prone position, nose forward, at the calibrated distance from the leading edge of the speaker to the mouse's interaural axis, on a thermostatically controlled blanket, inside a sound attenuating booth.
- Record a click-evoked ABR (70dB SPL) to ensure a good ABR is present (in non-impaired mice). Optional.
- ABRs are recorded to clicks (10�s duration, positive transient) presented from 0-85 dB SPL in 5dB steps, presented 256 times at 42.6/sec.
- ABRs are recorded to the following frequencies and levels; 6kHz (0-85dB SPL), 12kHz (0-85dB SPL), 18kHz (0-85dB SPL), 24kHz (0-85dB SPL) and 30kHz (0-85dB SPL), presented in 5dB intervals. Tone pips are 5ms in duration, with a 1ms rise/fall time, presented 256 times at 42.6/sec (optional values). Tone stimuli are presented in decreasing frequency order for a particular sound level and from low to high stimulus level.
- If deafness/hearing impairment is suspected for a particular mutant line (e.g. by elevated thresholds or absence of ABR waveforms at any stimulus level), all stimulus presentation levels should be, instrument permitting, extended to 95dB SPL.
- Record a final click-evoked ABR (70dB SPL), to check for any deterioration of the click-evoked response during recordings. Optional.
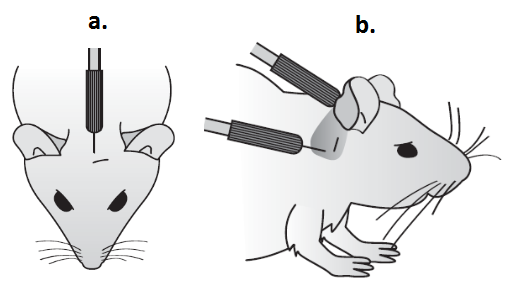
Figure 1. To indicate positioning of sub-dermal needle electrodes for ABR recording. a. Active electrode in position on the vertex. b. Reference/Earth electrode positioned behind the ear.
Notes
If other tests are being performed under the same anesthetic regime, it is advised to perform the ABR first.
Raw data is uploaded to a database for display of waveforms and threshold allocation for each mouse (See Figure 2) and for display of plots of threshold for each frequency and click for each individual mouse and for each mutant line.
Detailed methodology can be found in Ingham, Pearson & Steel (2011) Current Protocols in Mouse Biology 1: 279-287.
The information about the date of the experiment, that is the date when the measurement is performed, is an important parameter which is to be submitted in the Experiment xml file (dateOfExperiment="2013-02-28").
Threshold Analysis (Phase 1). Thresholds are defined for each mouse and for each stimulus as the lowest intensity at which any part of the ABR waveform can be visually recognized by a trained operator. Calls are made on data from each line based on a set of rules. For each stimulus, over 60% or more of thresholds must fall outside of a 95% reference range (based on a large population of wildtype data) for that result to be classed as significant. A manual call option can be used by an experienced operator to include or not include a particular dataset, to override the rules-based call. A line is called as significant if any one of the click or frequency stimuli are called as significant.
Waveform analysis (Phase 2 - Optional). Overlay plots of click-evoked waveforms recorded at threshold +20dB and +50dB are viewed by experienced operators to determine if there are any obvious abnormalities in waveform shape.
Input-Output functions (Phase 3 - Optional). If the waveforms appear abnormal, plots of P1-N1 and P3-N3 amplitude, P1, N1, P3 and N3 latency and P1-P3 and N1-N3 interpeak interval for click stimuli against dB sensation level (dB above click threshold) are generated. For each parameter, if 60% or more of values fall outside a 95% reference range for 5 adjacent sensation levels, the parameter is called as significant. Again, a manual override option allows operator discretion in judging calls made by these fixed rules.
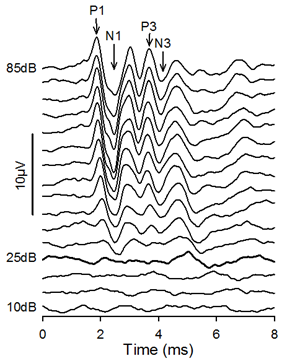
Figure 2. Click-evoked ABRs. In this case, threshold was determined to be 25dB SPL. The points on the waveform defined as P1, N1, P3 and N3 are indicated by arrows.
Data QC
- Sound System Calibration. Optionally a calibration curve is recorded at the start of each experimental day. These can be used to check the consistency of the sound delivery system over time. Once or twice annually, the calibration of this microphone used for sound delivery should be checked using a Bruel & Kjaer PULSE system with a Type 4231 calibrator calibrator or other equivalent calibration instrumentation suitable for use with high frequencies.
- Test Click ABR. Optionally the amplitude of the responses to the 70dB SPL click recorded at the start and end of the protocol can be compared to ensure there is no significant physiological deterioration of response.
- ABR thresholds. Thresholds are allocated to each stimulus for each mouse by a trained & skilled operator recording the data. A random selection of thresholds is checked by a second skilled operator.
Metadata Parameters examples
Metadata | Example |
Range of test stimuli used | The array of stimuli used to record ABRs. E.g. Click; 6,12,18,24,30kHz. |
Range of stimulus levels used - Click | The range of stimulus levels used for click. E.g. 0-85dB SPL. |
Range of stimulus levels used - 6kHz | The range of stimulus levels used for tone at 6kHz. E.g. 20-85dB SPL. |
Range of stimulus levels used - 12kHz | The range of stimulus levels used for tone at 12kHz. E.g. 0-85dB SPL. |
Range of stimulus levels used - 18kHz | The range of stimulus levels used for tone at 18kHz. E.g. 0-85dB SPL. |
Range of stimulus levels used - 24kHz | The range of stimulus levels used for tone at 24kHz. E.g. 10-85dB SPL. |
Range of stimulus levels used - 30kHz | The range of stimulus levels used for tone at 30kHz. E.g. 20-85dB SPL. |
Extension of stimulus levels | The extension of the stimulus level used if any, due to suspected hearing impairment. E.g. 95 dB SPL. |
Stimulus level step size | The frequency increase step size of the stimulus level. E.g. 5dB. |
Tone Pip Duration | The duration of the tone pip. E.g. 5ms. |
Tone Pip rise/fall | The rise/fall time of the tone pip. E.g. 1ms. |
Repetition Rate | The rate of the stimuli presentation. E.g. 42.6/s |
Number averages | The number of times the tone is presented. E.g. 256. |
Recording Environment | The mouse environment during the recording. E.g. In sound attenuating booth on thermo-statically controlled heating pad (@ 37°C). |
Anesthetic agent 1 | Anesthetic 1 used to sedate the mouse. E.g. Ketamine. |
Anesthetic agent 2 | Anesthetic 2 used to sedate the mouse. E.g. Xylazine. |
Anesthetic agent 1 dosage | Dosage for anesthetic 1. E.g. 1mg/g. |
Anesthetic agent 2 dosage | Dosage for anesthetic 2. E.g. 0.01mg/g |
Anesthetic administration route | The route of anesthetic administration. E.g. Intraperitoneal (i.p.). |
Date of Test | Date of test execution. |
Time of injection | Time of anesthetic injection. |
Equipment ID | When more than 1 machine having same model and manufacturer is used, e.g. machine 1, machine 2, machine Minnie, machine Mickey Mouse, etc. |
Equipment manufacturer | Manufacturer of the equipment. E.g. TDT (Tucker Davis Technologies). |
Equipment model | Model of the equipment. E.g. RP2.1 based system, RA4PA Medusa Preamplifier. |
Software | The software used to control signal presentation and data acquisition. E.g. Sanger bespoke averager software. |
Experimenter ID | An ID of any format to be used coherently both inside the same procedure and for all procedures. E.g. Harw_001, or 1/2/3. |
Date equipment last calibrated | Most recent date in which the equipment (or any part of) used in the procedure was subject to a calibration event. |