Jump to:
Purpose
To provide a high throughput method to obtain Electrocardiograms in a conscious mouse or an anesthetized mouse.
Experimental Design
Procedure
Conscious Procedure with ECGenie
- The lead plates are to be snapped into place onto the top of the pre-amplifier tower. The covering is removed to reveal three gel coated pads surrounded by a sticking plate. The plate will need to be covered with the extra cover in the package.
- Turn on the combined amplifier and the pre-amplifier tower.
- Double click the icon ECG acquisition on the acquisition computer.
- Open the ECG set up file (for default settings).
- Place mouse on pad, lowering the Red Acrylic Cubby to surround the mouse on 3 sides discouraging escape.
- Press Start.
- After the desired acquisition time, (5-10 minutes) stop the reading. There will be one long reading.
- Save the data.
- For additional readings create a new session using the same settings as before.
- When saving sections with good readings, highlight the selected area and then save.
Anesthetized Procedure
- Place mouse in the induction chamber. Anesthetize with 2.5-4% isoflurane in oxygen.
- Transfer mouse to a warmed platform and maintain with a nose cone at 2-2.5% isoflurane.
- Fasten the mouse to the heated platform set to 37.5-39o Add electrode cream if using the foot surface electrodes on the platform surface. Alternatively insert needle electrodes subcutaneously into the limbs using Lead Configuration I: Left Arm – Right Arm (LA-RA) and/or Lead Configuration II: Left Leg – Right Arm (LL-RA).
- Monitor the body temperature with a rectal probe if possible.
- Open the recording software with appropriate settings and record an ECG for about 2 minutes.
- Save the recording and allow mouse to recover.
Notes
Data Analysis - Conscious Procedure with ECGenie
- Open Emouse Analyses icon
- Select ECG signals
- Choose folder (all readings in folder will show)
- Click PNN X (for mice: N-N> than 6 ms)
- Choose file(s) by highlighting
- Go
- Bottom file is the corrected file
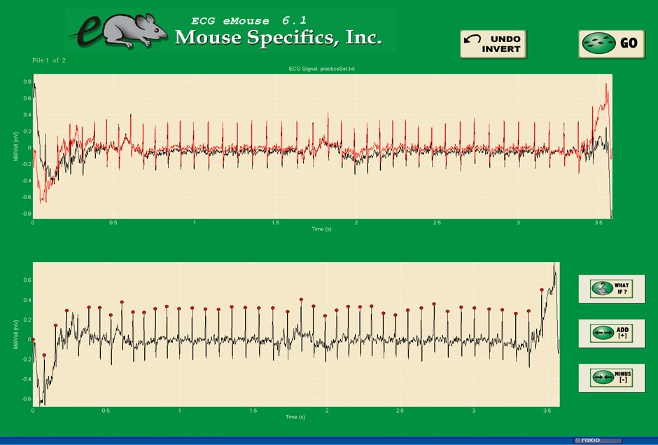
- Red dots should be on peak of R waves, if image appears inverted click invert
- Click Add, or minus if R waves are not marked with red dots or if too many are marked
- L click to zoom in
- R click to zoom out
- ?What if?? button to remove unwanted sections
- L click image (zooms in)
- L click left boundary
- L click right boundary
- Options- click more if want to exclude more sections
- Undo available
- Go
- Here can input animal data if desired
- Save- For the first mouse in in group, hit save, a new results folder will be created within the folder with the mouse data. Then can click quick save or next.
- For the rest of the mice in the series, can hit quick save at this point- saves in last selected file – will group all files together in same excel sheet.
- Open Emouse Analyses icon
- Select ECG signals
- Choose folder (all readings in folder will show)
- Click PNN X (for mice: N-N> than 6 ms)
- Choose file(s) by highlighting
- Go
- Bottom file is the corrected file
- Red dots should be on peak of R waves, if image appears inverted click invert
- Click Add, or minus if R waves are not marked with red dots or if too many are marked
- L click to zoom in
- R click to zoom out
- ?What if?? button to remove unwanted sections
- L click image (zooms in)
- L click left boundary
- L click right boundary
- Options- click more if want to exclude more sections
- Undo available
- Go
- Here can input animal data if desired
- Save- For the first mouse in in group, hit save, a new results folder will be created within the folder with the mouse data. Then can click quick save or next
- For the rest of the mice in the series, can hit quick save at this point- saves in last selected file - will group all files together in same excel sheet
Examples of good readings
Data QC
Analysis room should be dim and quiet. Keep the door closed preferably while analysis is taking place.
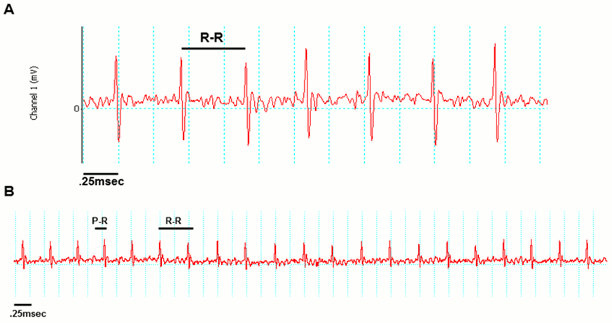
Figure A. Taking a reading
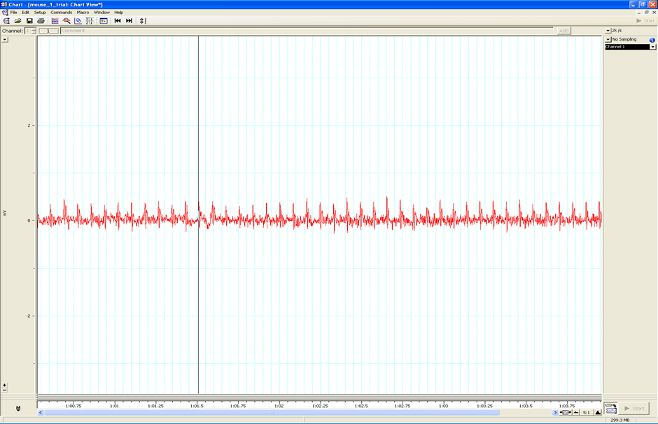
Figure B. Saving a section of the reading
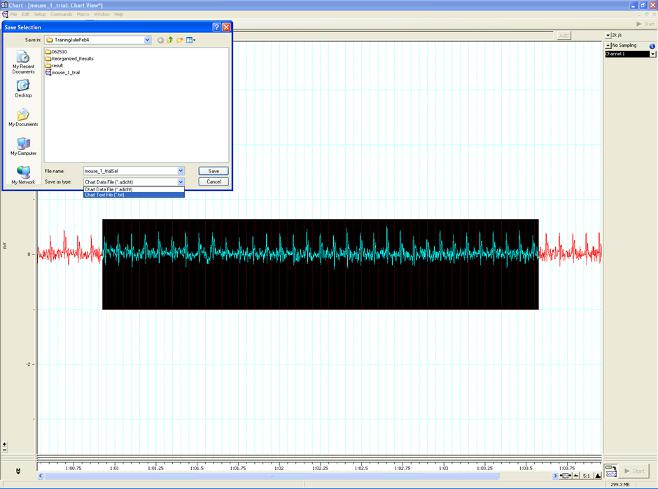
Figure C. Analysis phase, with the options to remove sections on the ?What if?? button below.
Data Analysis - Anesthetized Procedure
- Review the tracing and note any abnormal findings. Take images for upload where required.
- Analyse all or a selection of the tracing (approximately 100 beats minimum).
- If using LabChart software (ADInstruments), select Mouse preset and QTc = Bazett.
- The software can automatically mark the P, QRS and T waves of each beat (Beats to average = 1) and calculate the interval and amplitude data. The average of all beats will be determined for each parameter.
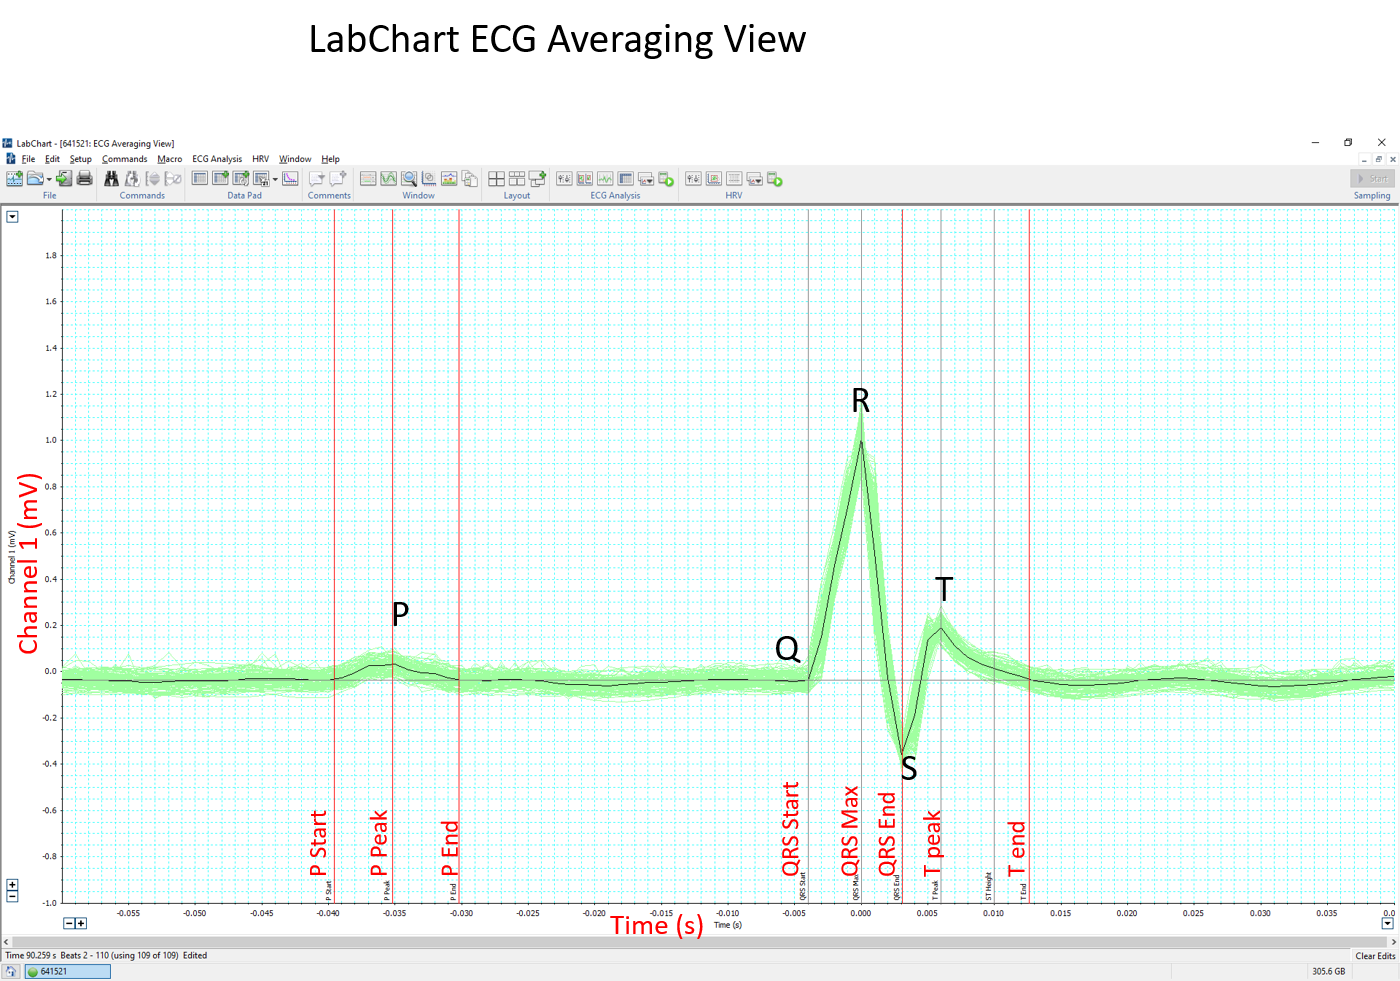
- Alternatively, an averaged tracing can be generated first (Block Averaging). Markers for the P, QRS and T waves are placed by the software but can be adjusted according to the centre criteria. Interval and amplitude data is then generated by the software.
Example of the LabChart8 ECG setting
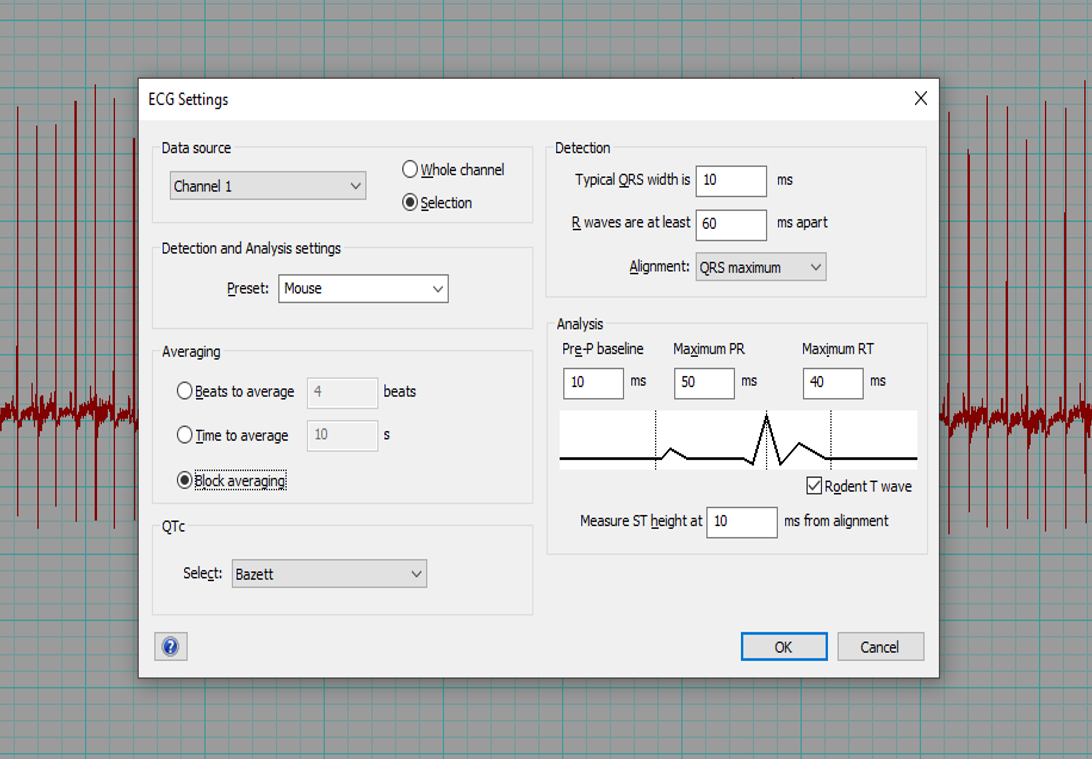
Example of LabChart ECG Averaging View