Phenotypes section
The Phenotypes section has three tabs. Each tab provides different views of the data, emphasising different aspects, so users can quickly find what they are looking for.
- Significant phenotypes table
- Measurements chart display
- All data table
Significant phenotypes table
The significant phenotypes table shows significant genotype-phenotype effects as identified by the IMPC applying dedicated phenotyping tests and statistical procedures. Phenotypes in the mutant mice that differ from those of the controls are annotated using a Mammalian Phenotype (MP) Ontology term, e.g. MP:0001513 – limb grasping, an ontology designed to describe abnormalities in mouse strains.
By clicking on the row, the chart page is displayed.
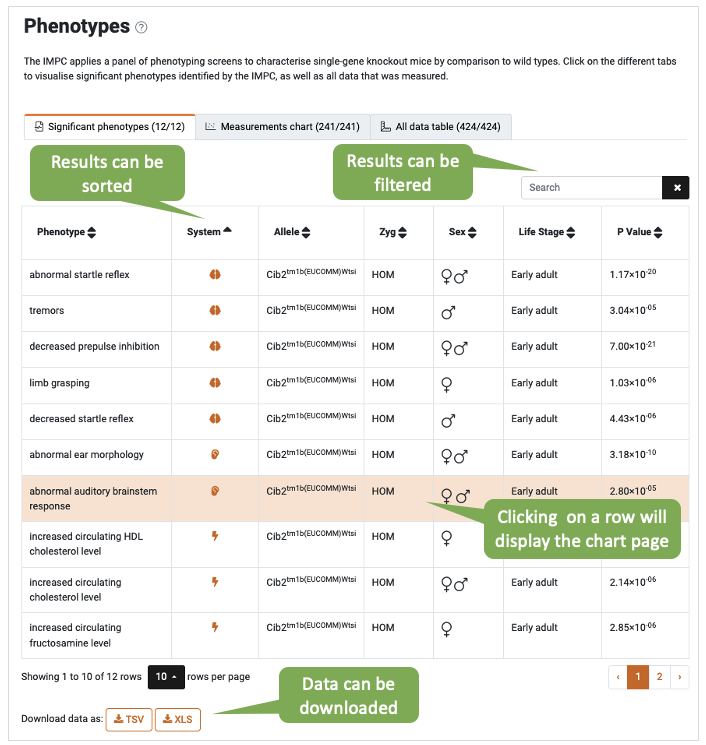

Note that multiple parameters can be associated with the same phenotype, or more than one mouse strain may have been phenotyped. Thus, when multiple associations are established with one phenotype, only the most sigificant association (P value) is shown in this table.
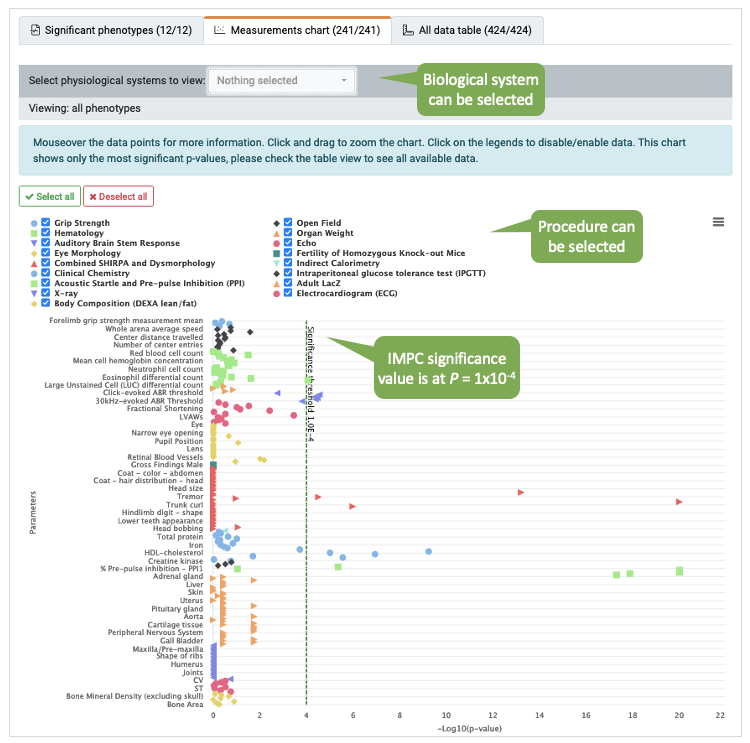
Measurements chart
Here the most significant result for each parameter is displayed. Results can be filtered by physiological system (drop-down menu) and/or procedure (chart legend). Hovering over the points shows measurement-related information. Clicking on the points displays the underlying data by opening up the chart page.
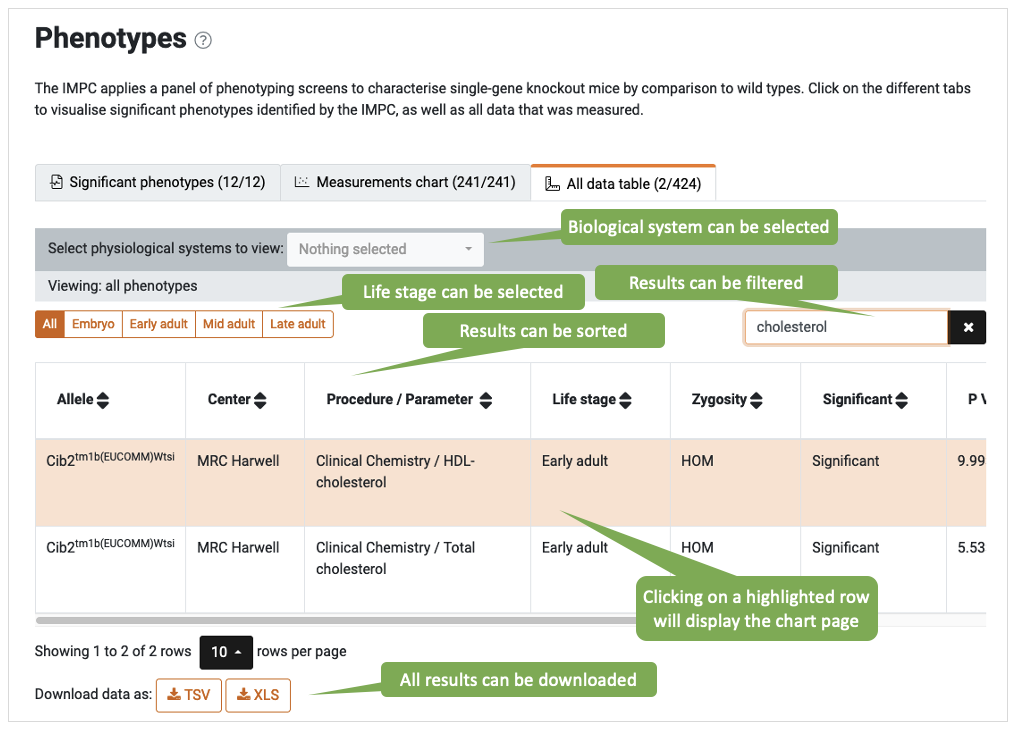
All data table
The All data table displays all data available for all knockout mouse lines associated with a gene.